Data Visualisation Library Design
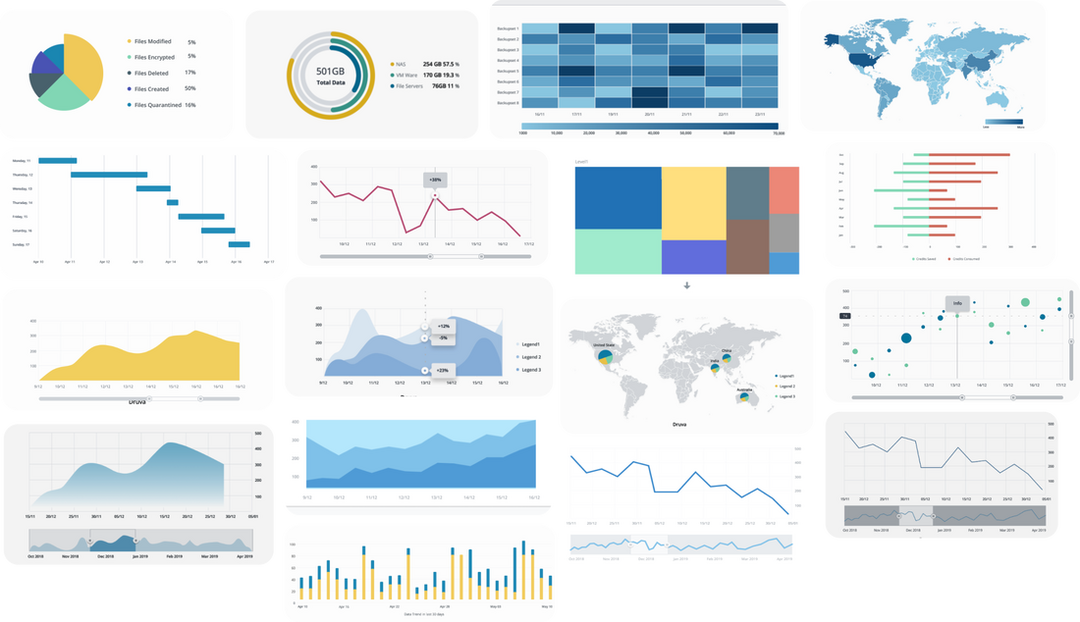
Data Visualisation library Design is a Design Language System design project where I created the Data Visualisation library based on the organisations domain where we have all the charts and their design specification .
These charts were later used by all the products in the organisation it helped in bringing the synergy in the products.
Making is prossess of dashboard design easy and fast.
Reducing the rework in the Design and Development
Designing the more usable and correct dashboards
These charts were later used by all the products in the organisation it helped in bringing the synergy in the products.
Making is prossess of dashboard design easy and fast.
Reducing the rework in the Design and Development
Designing the more usable and correct dashboards

Research
Quantitative research
User interviews of Users to understand their goals and proficiency with the visualisation.
Brainstorming on what kind of data we have and what are the ways we can show that data to highlight the useful information
- Analysed all the products and scenarios that are being used currently in the organization
- Analysed all the new product that are being developed and will be devoloped in near future
- Extensive research on all the industry standard products and dashboard that matches organisations domain and complexity
User interviews of Users to understand their goals and proficiency with the visualisation.
Brainstorming on what kind of data we have and what are the ways we can show that data to highlight the useful information
Design
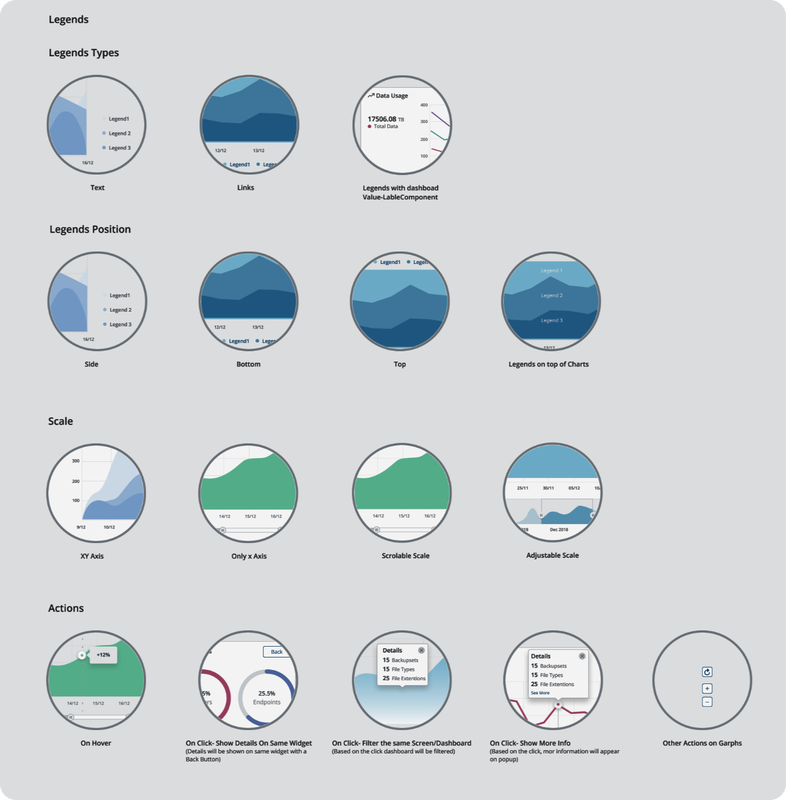
- Selecting the chart based on the research findings of users proficiency with the charts
- Defining the usage of each chart in the products. When it should be used. How it should be used. How and when it should not be used
- Designing specification for each chart
- Designing patterns for each and every chart
- Defining the specification of all chart components legend, Scale, Title Sub texts, Headings, Subheadings
- Defining patterns for simple chart representing one or two dimensional data
- Defining patterns for complex chart and a combination of two charts
- Working with Dev team to implement the library
- UI review and Design communication with product teams
Results